You've deployed a new feature to a subset of users, how do you test and monitor this new feature without it being 'lost in the noise'?
Canary deployments are one of the ways we can release updates without violating our Service Level Agreements (SLAs) with our users. By rolling out new code to a small subset of users and looking at the results, we allow a final testing phase with live users before everyone sees our changes. If problems are detected and fixed before updates roll out to all users, we can generally prevent most users from ever knowing that we tried to release broken code.
The reason to use canary deployments is very similar to the reason to run synthetic monitoring with Checkly: our production code running in the real world can encounter problems that can’t be foreseen, no matter how much pre-release testing we do.
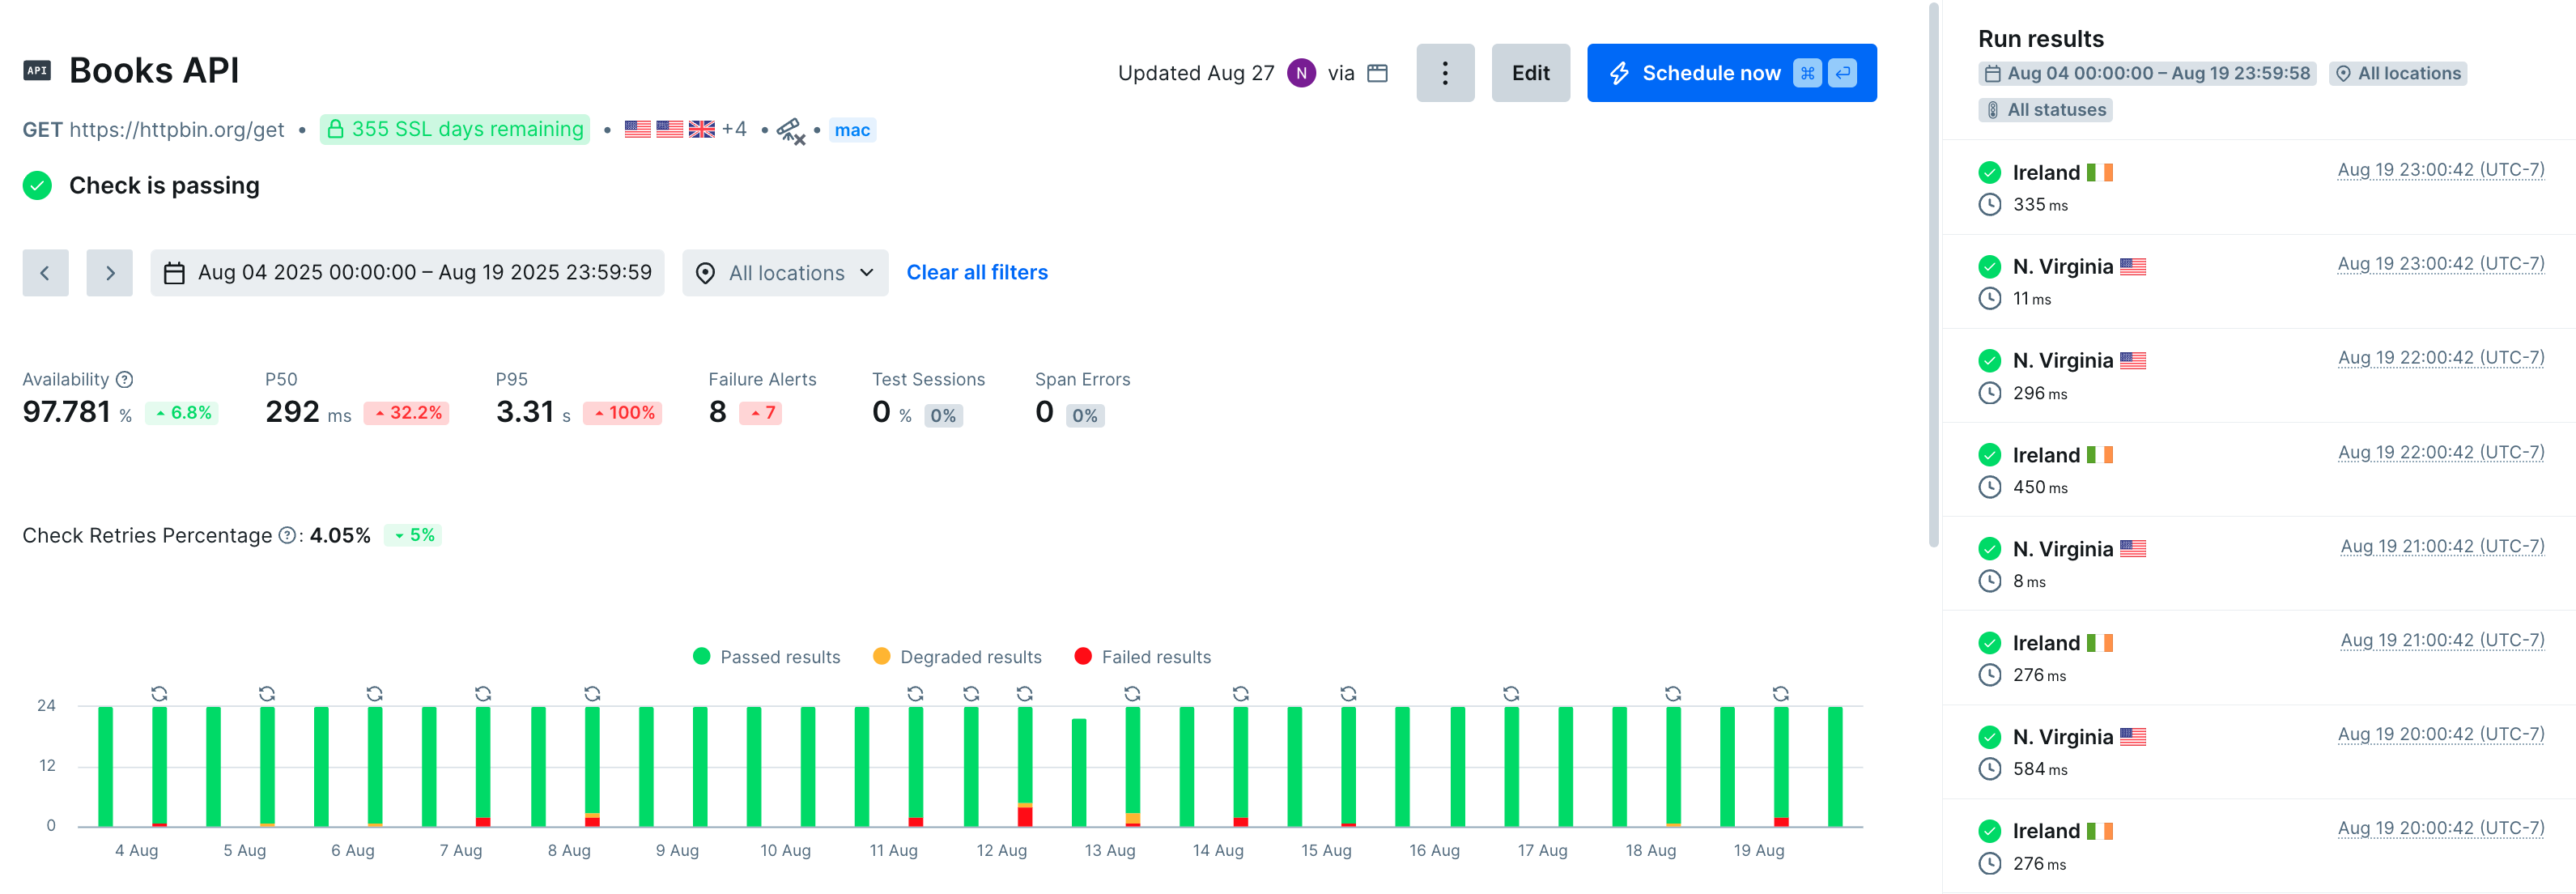
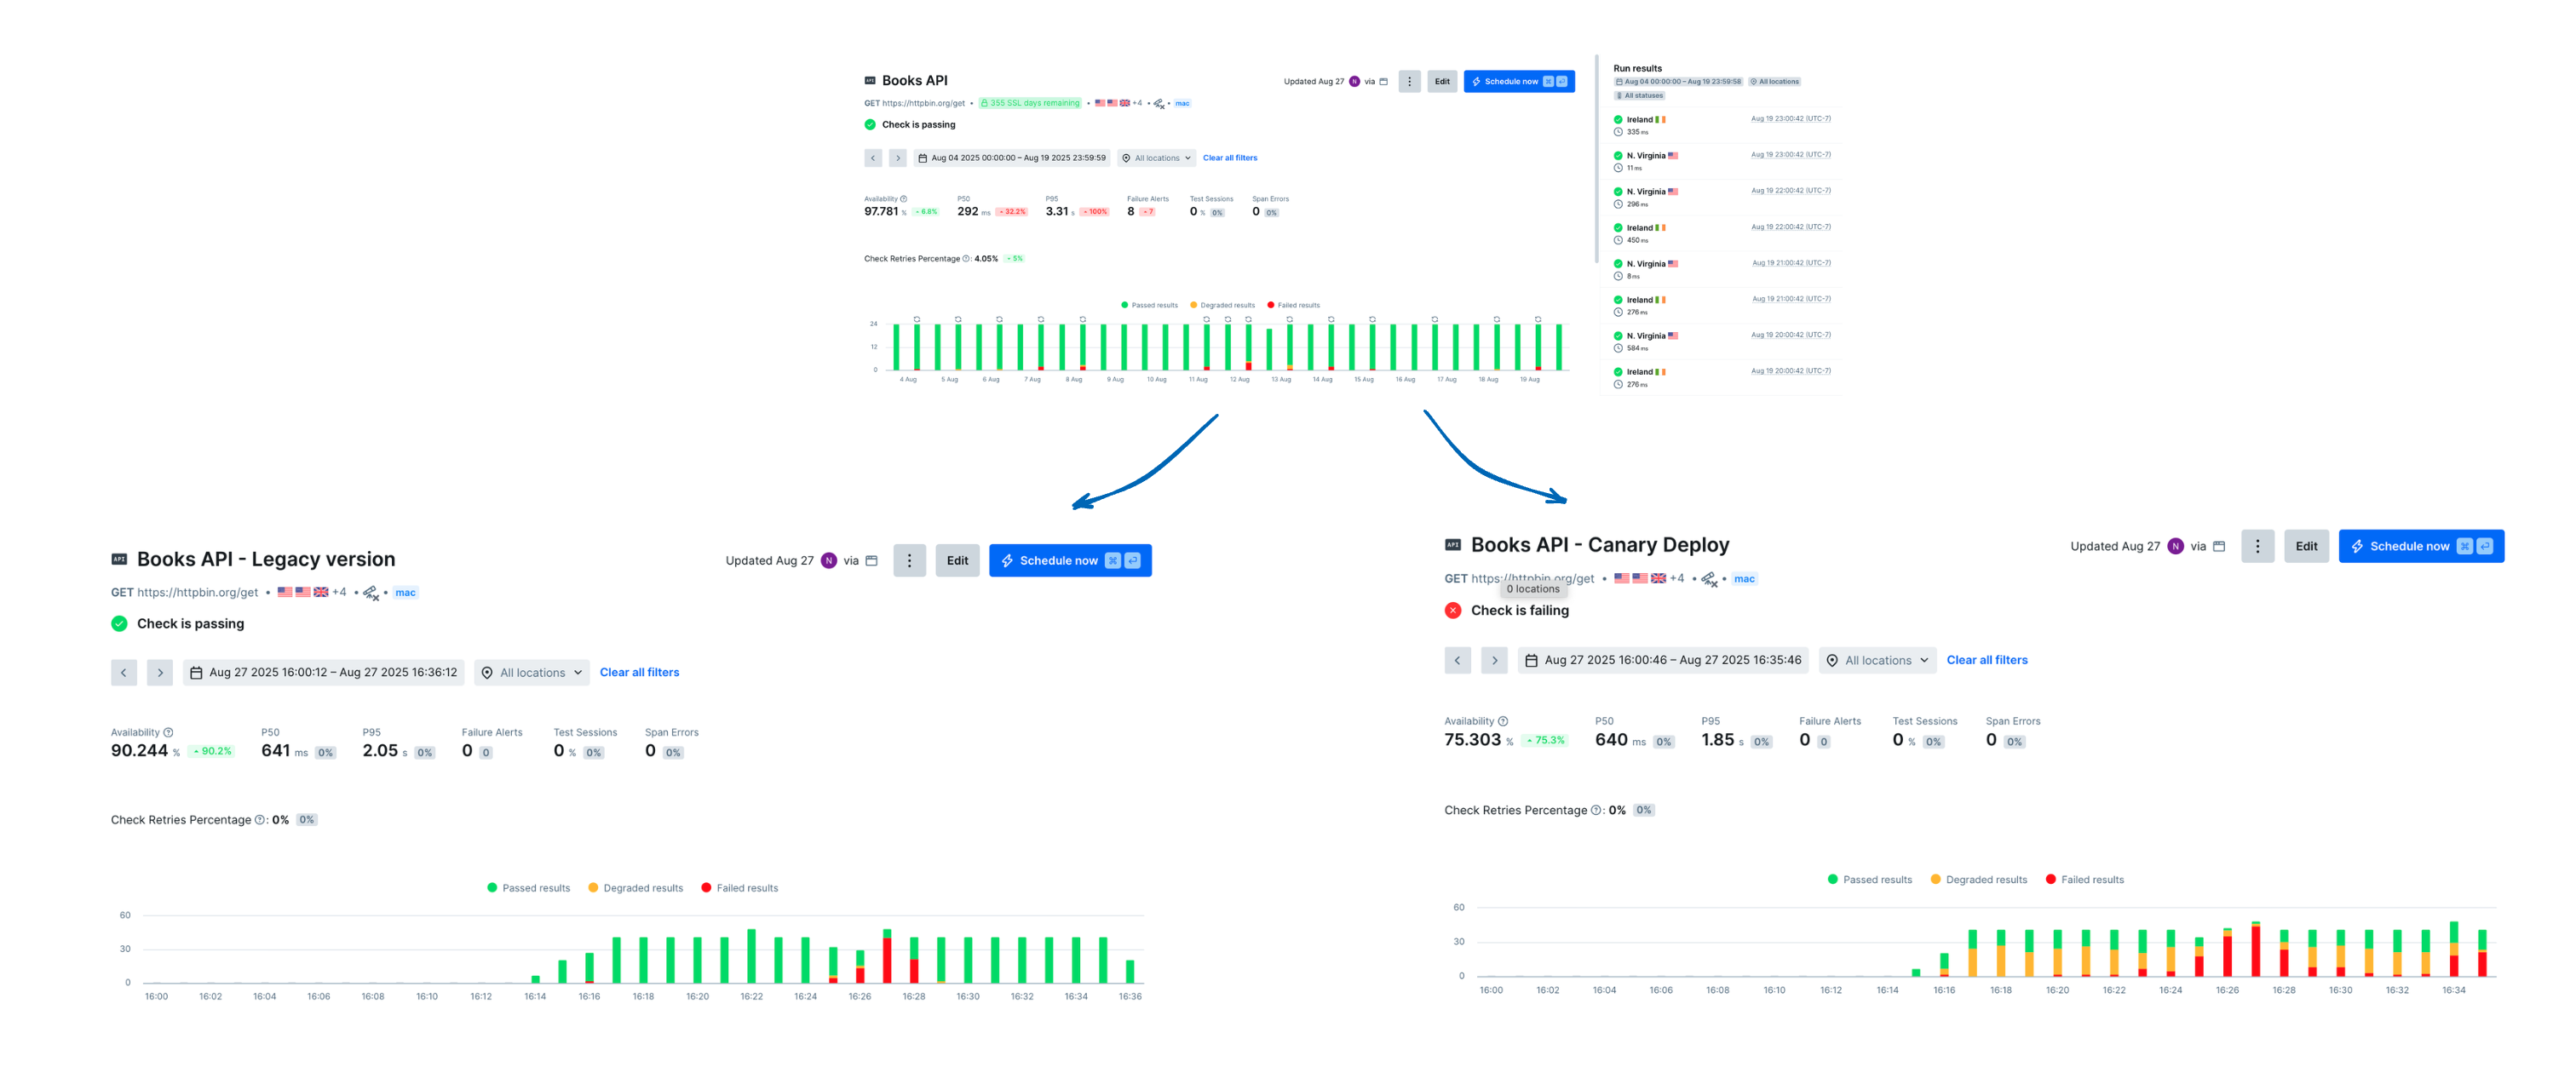
But here’s the problem with synthetic monitoring during a canary deployment: if the deployment is broken, the signal of that failure will be effectively hidden by all the working versions of the service that aren’t yet running the new code. Here’s a dashboard that might give us some concern during a canary deployment:

The goal, then, is to separate out our Canary data, and see charts of failures specific to our environment.

This guide will show you how Checkly can enhance your canary deployments, running synthetic monitors against the canary versions of your services. We’ll use headers to set feature flags, environment variables to dynamically shift how we’re checking our site, and with the monitoring as code model we’ll dynamically create new monitors as needed to track how our experiments are performing.
One final note, canary deployments are sometimes called blue-green deployments, though some think the two terms imply slight differences in implementation.
Our Scenario: Checkly and Canary Deployments
Our site is releasing major new features and we’re running a canary deployment to make sure everything’s working. Visitors to the site are randomly assigned to a canary group, and receive an additional header on their page requests that activates the new features. Essentially our canary deploy is setting this feature flag to ’true’ for a number of users.
We’re already monitoring the site with Checkly’s browser and API synthetics monitors, and using uptime monitoring to make sure that every URL is available. If we change nothing about our Checkly configuration, some check runs will be randomly assigned to the canary group, and the rest will run with the same set of features as most visitors. We’d like to enhance this experience during our canary deployment. Here are three use cases to better support canary deployments:
-
For better reliability, we want active control over whether a check runs as a user that can see the canary deployment.
-
Our engineers want to integrate our Checkly monitors into their deploy process, letting us roll back deployments if monitors fail.
-
For some checks, we want a version that reports separate data for just this canary deployment, with a chart on our Checkly web UI showing how checks in the canary group are performing.
At Checkly, we’re on a mission to empower developers, making it easier to detect, communicate, and resolve problems before they affect users.
These improvements will help us better detect problems with our canary deployment, with clearer ways to communicate the results of checks and their context to our team. With clear results information, our team can resolve issues faster, making every canary deployment a smoother experience for engineers and users.
1. Set Feature Flags With Headers & User Agents
In our scenario, we can control whether we get the canary version of our service with a feature flag. By controlling a request’s headers, we can set the user agent or add arbitrary header values to our requests. Let’s set some headers in an API check, a Browser check, and a more complex Multistep API check.
A. Set Headers for an API Check
When running API Checks, headers are part of your configuration. You can add HTTP headers in the Checkly web UI when setting up your API Checks, but since we developers prefer to use monitoring as code, here’s how to control API Checks’ headers right from your IDE. API Checks are created as a Checkly construct, and we can create a new one by creating a new file in our Checkly Project (if you haven’t set up a Checkly Project or used monitoring as code before, check out our getting started tutorial before returning here to start modifying headers):
import { ApiCheck, AssertionBuilder } from 'checkly/constructs'
import * as path from 'path'

new ApiCheck('hello-api-canary', {
  name: 'Hello API, Canary Headers',
  activated: true,
  maxResponseTime: 10000,
  degradedResponseTime: 5000,
  request: {
    method: 'POST',
    url: 'https://httpbin.org/post',
    skipSSL: false,
    followRedirects: true,
    headers: [
      {
        key: 'canary',
        value: 'true'
      }
    ],
    assertions: [
        AssertionBuilder.statusCode().equals(200),
        AssertionBuilder.jsonBody('$.name').notEmpty(),
        AssertionBuilder.headers('strict-transport-security', 'max-age=(\\d+)').greaterThan(10000), //checking the headers of the response
    ]
  }
})
Since headers are part of the basic configuration of your check, you can populate headers with environment variables, and edit headers for multiple checks by adding them to a group. We’ll use these techniques in parts 2 and 3, below.
B. Set Headers in a Browser Check
Headers for requests are not part of the basic configuration of Browser checks. In part because an automated browser will make many checks as part of a single run, and it wouldn’t be clear exactly which requests should have an additional header. It’s quite easy to add headers to some or all requests from a check written in Playwright, with a specialized version of request interception. In this example, we only want to modify requests for SVG files with our new header:
import { test, expect } from '@playwright/test'

test.describe('Danube WebShop Book Listing', () => {
  test('Books Listing', async ({ page }) => {
    await page.route('**/*.svg', async route => { //any route ending in .svg
      const headers = route.request().headers();
      headers['canary'] = 'true'; //add a property
      await route.continue({ headers }); //let the request continue with the updated headers
    });
    await page.goto('https://danube-web.shop/') //the header will be added to any requests with a *.svg route

    //Check listed books

  })
})
By adding a call to page.route, we ensure that every single request within this page is modified. Alternatively, we could manage browser.context() so that only some requests have these new headers. Note that using multiple browser tabs with different browser.newContext() calls may have unexpected effects on your capture of traces and video from your check runs, which is why we’ve gone with the await page.route() method here.
The example above filters for all requests with a route ending in .svg, but you can also filter by resource type, method, post data and more. A full list of the properties available on a request is in the Playwright documentation.
Note: in this example we’ve modified the headers of our outgoing request, and in the context of feature flags and canary deploys there’s no reason we’d want to modify the response’s headers, but just in case you’ve come to this page looking for how to modify the response in Playwright, you would add route.fulfill({header:value}). The process is documented on our Learn site under ‘response interception.’
C. Set Headers in a Multistep API Check
A Multistep check uses Playwright scripting to perform a series of API requests with more complex evaluation of the response. Since we’re only making API requests, we can feed in new headers as a property.
In this example, we are making a pair of sequential API checks, the second test step relying on the results of the first step. Both requests use our header settings.
import { test, expect } from '@playwright/test'

//we use the SpaceX API here as it's complex enough to warrant a Multistep API check
const baseUrl = 'https://api.spacexdata.com/v3'

test('space-x dragon capsules', async ({ request }) => {
  const headers = {
    'canary': 'true'
  };
  const [first] = await test.step('get all capsules', async () => {
    // add our headers to this request
    const response = await request.get(`${baseUrl}/dragons`, { headers })
    expect(response).toBeOK()
    const data = await response.json()
    expect(data.length).toBeGreaterThan(0)
    return data
  })

  await test.step('get single dragon capsule', async () => {
    const response = await request.get(`${baseUrl}/dragons/${first.id}`, { headers })
    expect(response).toBeOK()

    const dragonCapsule = await response.json()
    expect(dragonCapsule.name).toEqual(first.name)
  })
})
Note that to create a Multistep API check in your own project you’ll also need to create a .check.ts file, but this is left out of this guide for brevity, since there don’t need to be any settings in the MultiStepCheck construct to add canary headers.
These methods let you add canary headers to any Checkly monitor. Next, we can make sure that these modified headers look correct for each of our monitors. Let’s run our checks once with npx checkly test.
D. Check our Modified Headers
In our example scenario, our header configuration is quite simple, with just a static key-value pair. But in a real-world scenario, we might be adding multiple values to a header, possibly with dynamic values as part of an authentication process. As such, it’s important to check that our updated headers are working before deploying our monitors. We’ll run checkly test with the --record flag to get a report on our check runs:
npx checkly test --record
For our demo, we have no other monitors in the /__checks__ directory, so the three monitors we created will be all that is run (again, if you are feeling lost as we add monitors by creating new files, and manage our project, check out the beginner’s guide to Checkly and monitoring as code).
➡️ npx checkly test --record
Parsing your project... ✅

Validating project resources... ✅

Bundling project resources... ✅

Running 3 checks in eu-west-1.

__checks__/api-check-newstyle.check.ts
  ✔ Hello API, Canary Headers (286ms)
__checks__/book-listing-canary.spec.ts
  ✔ book-detail-listing.spec.ts (6s)
__checks__/multistep-api-canary.check.ts
  ✔ Multi-step API Canary Check (586ms)

3 passed, 3 total

Detailed session summary at: https://chkly.link/[yourUniqueLink]
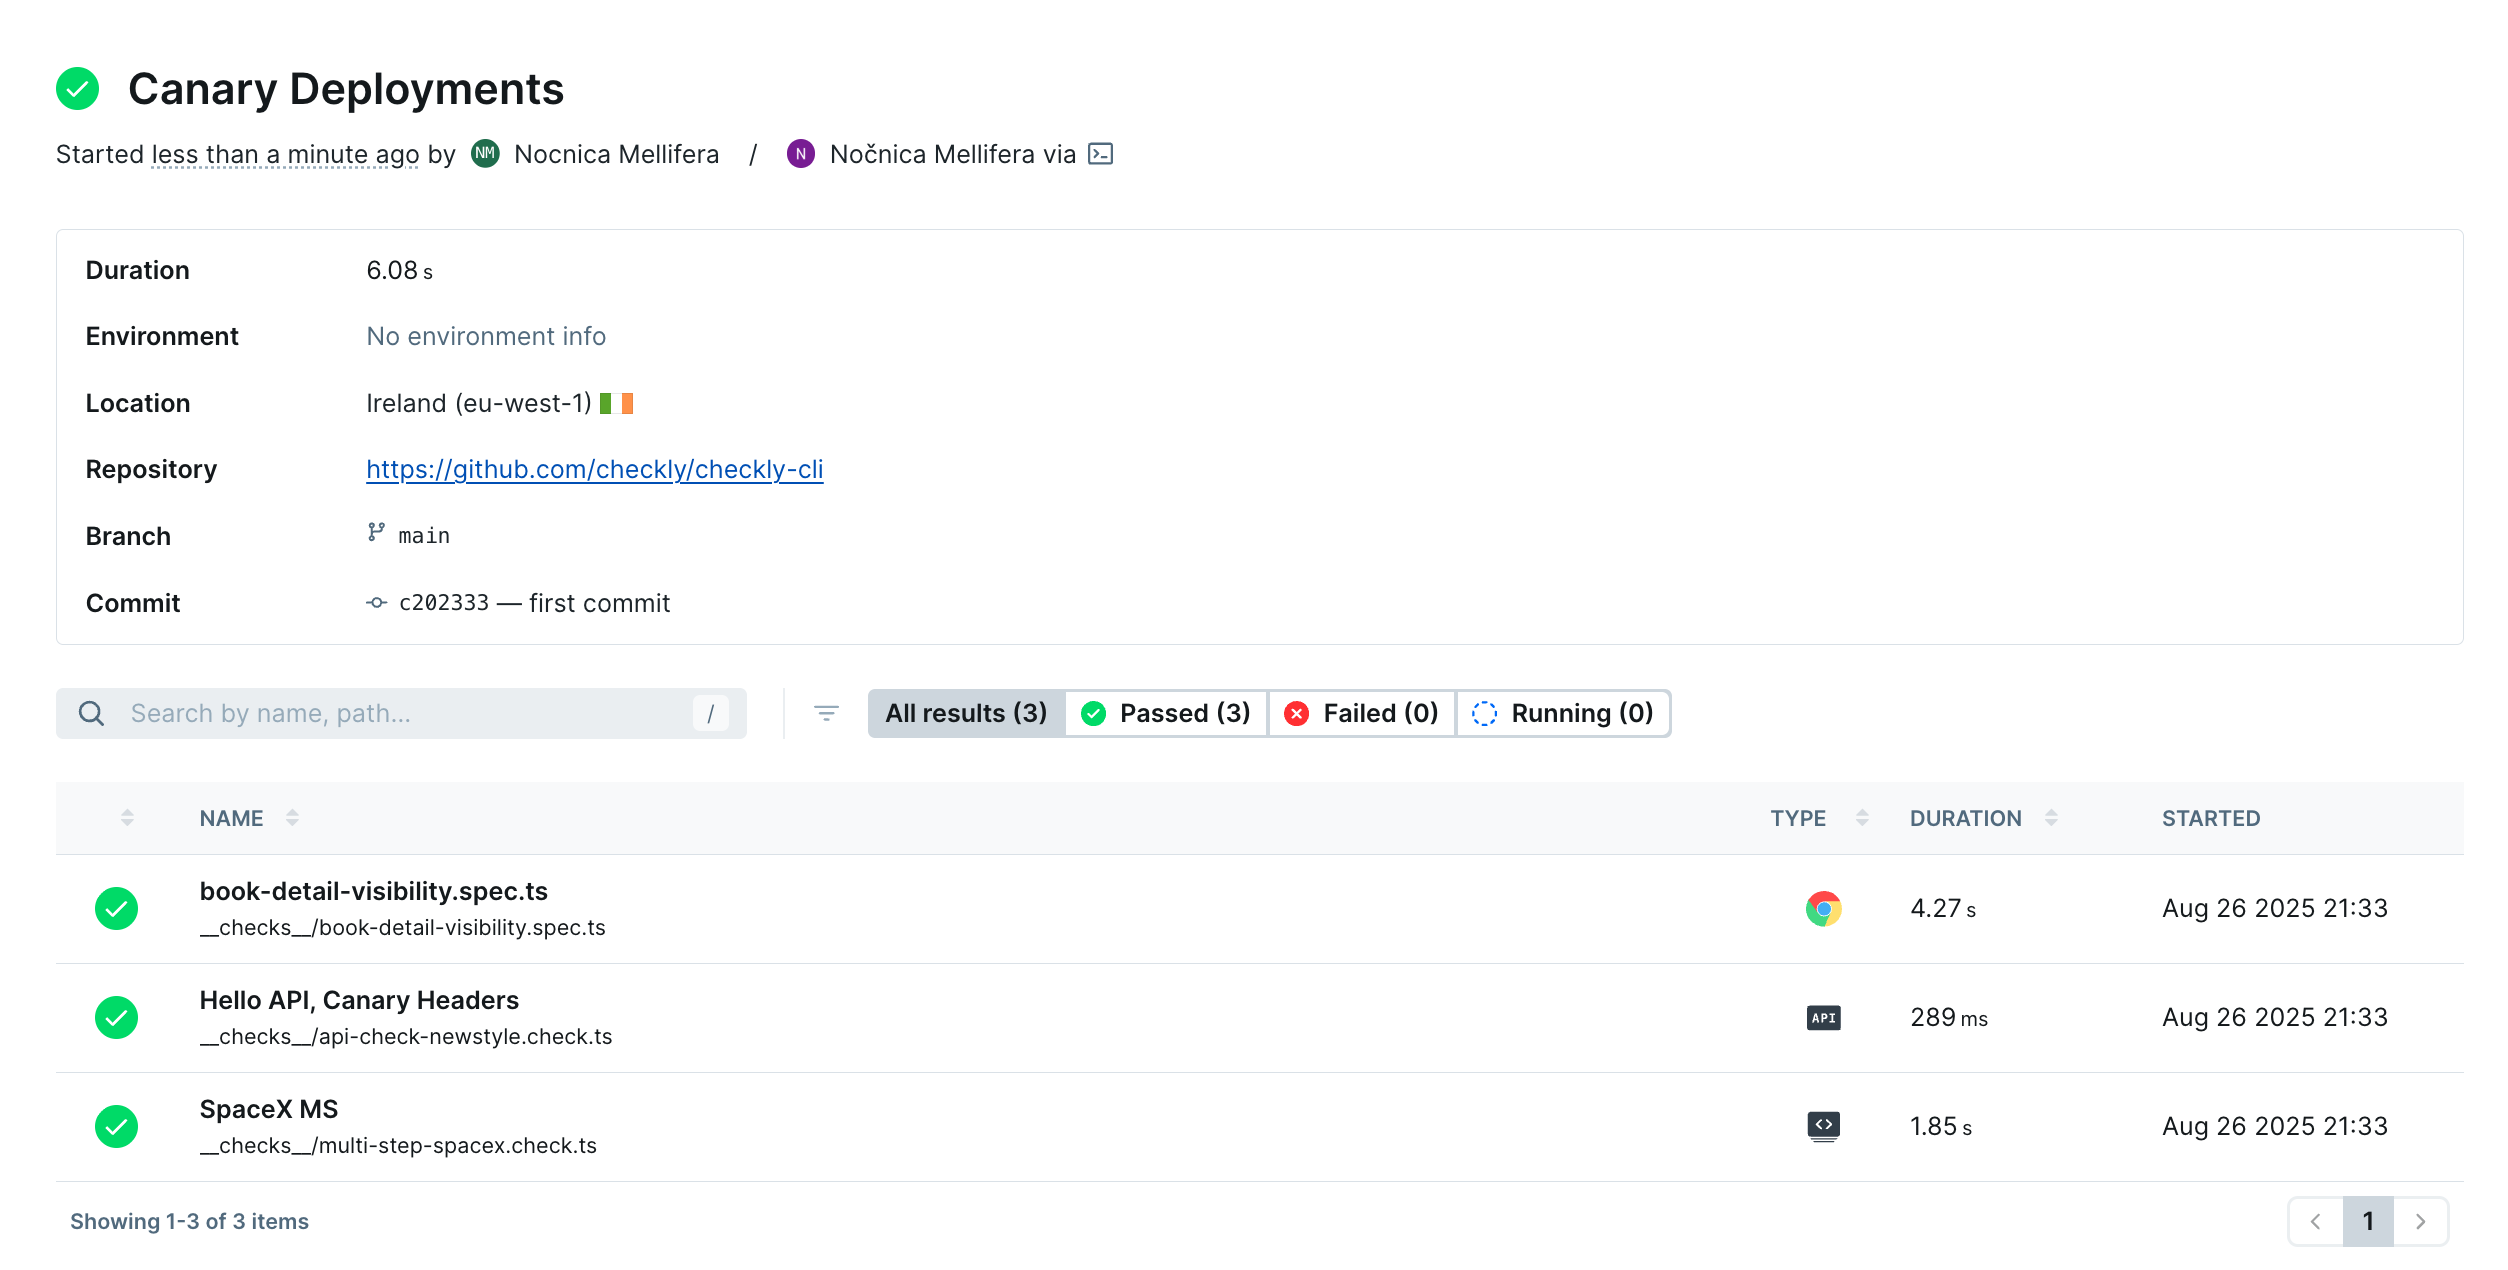
At the unique link provided, we can see all our check runs succeeded.

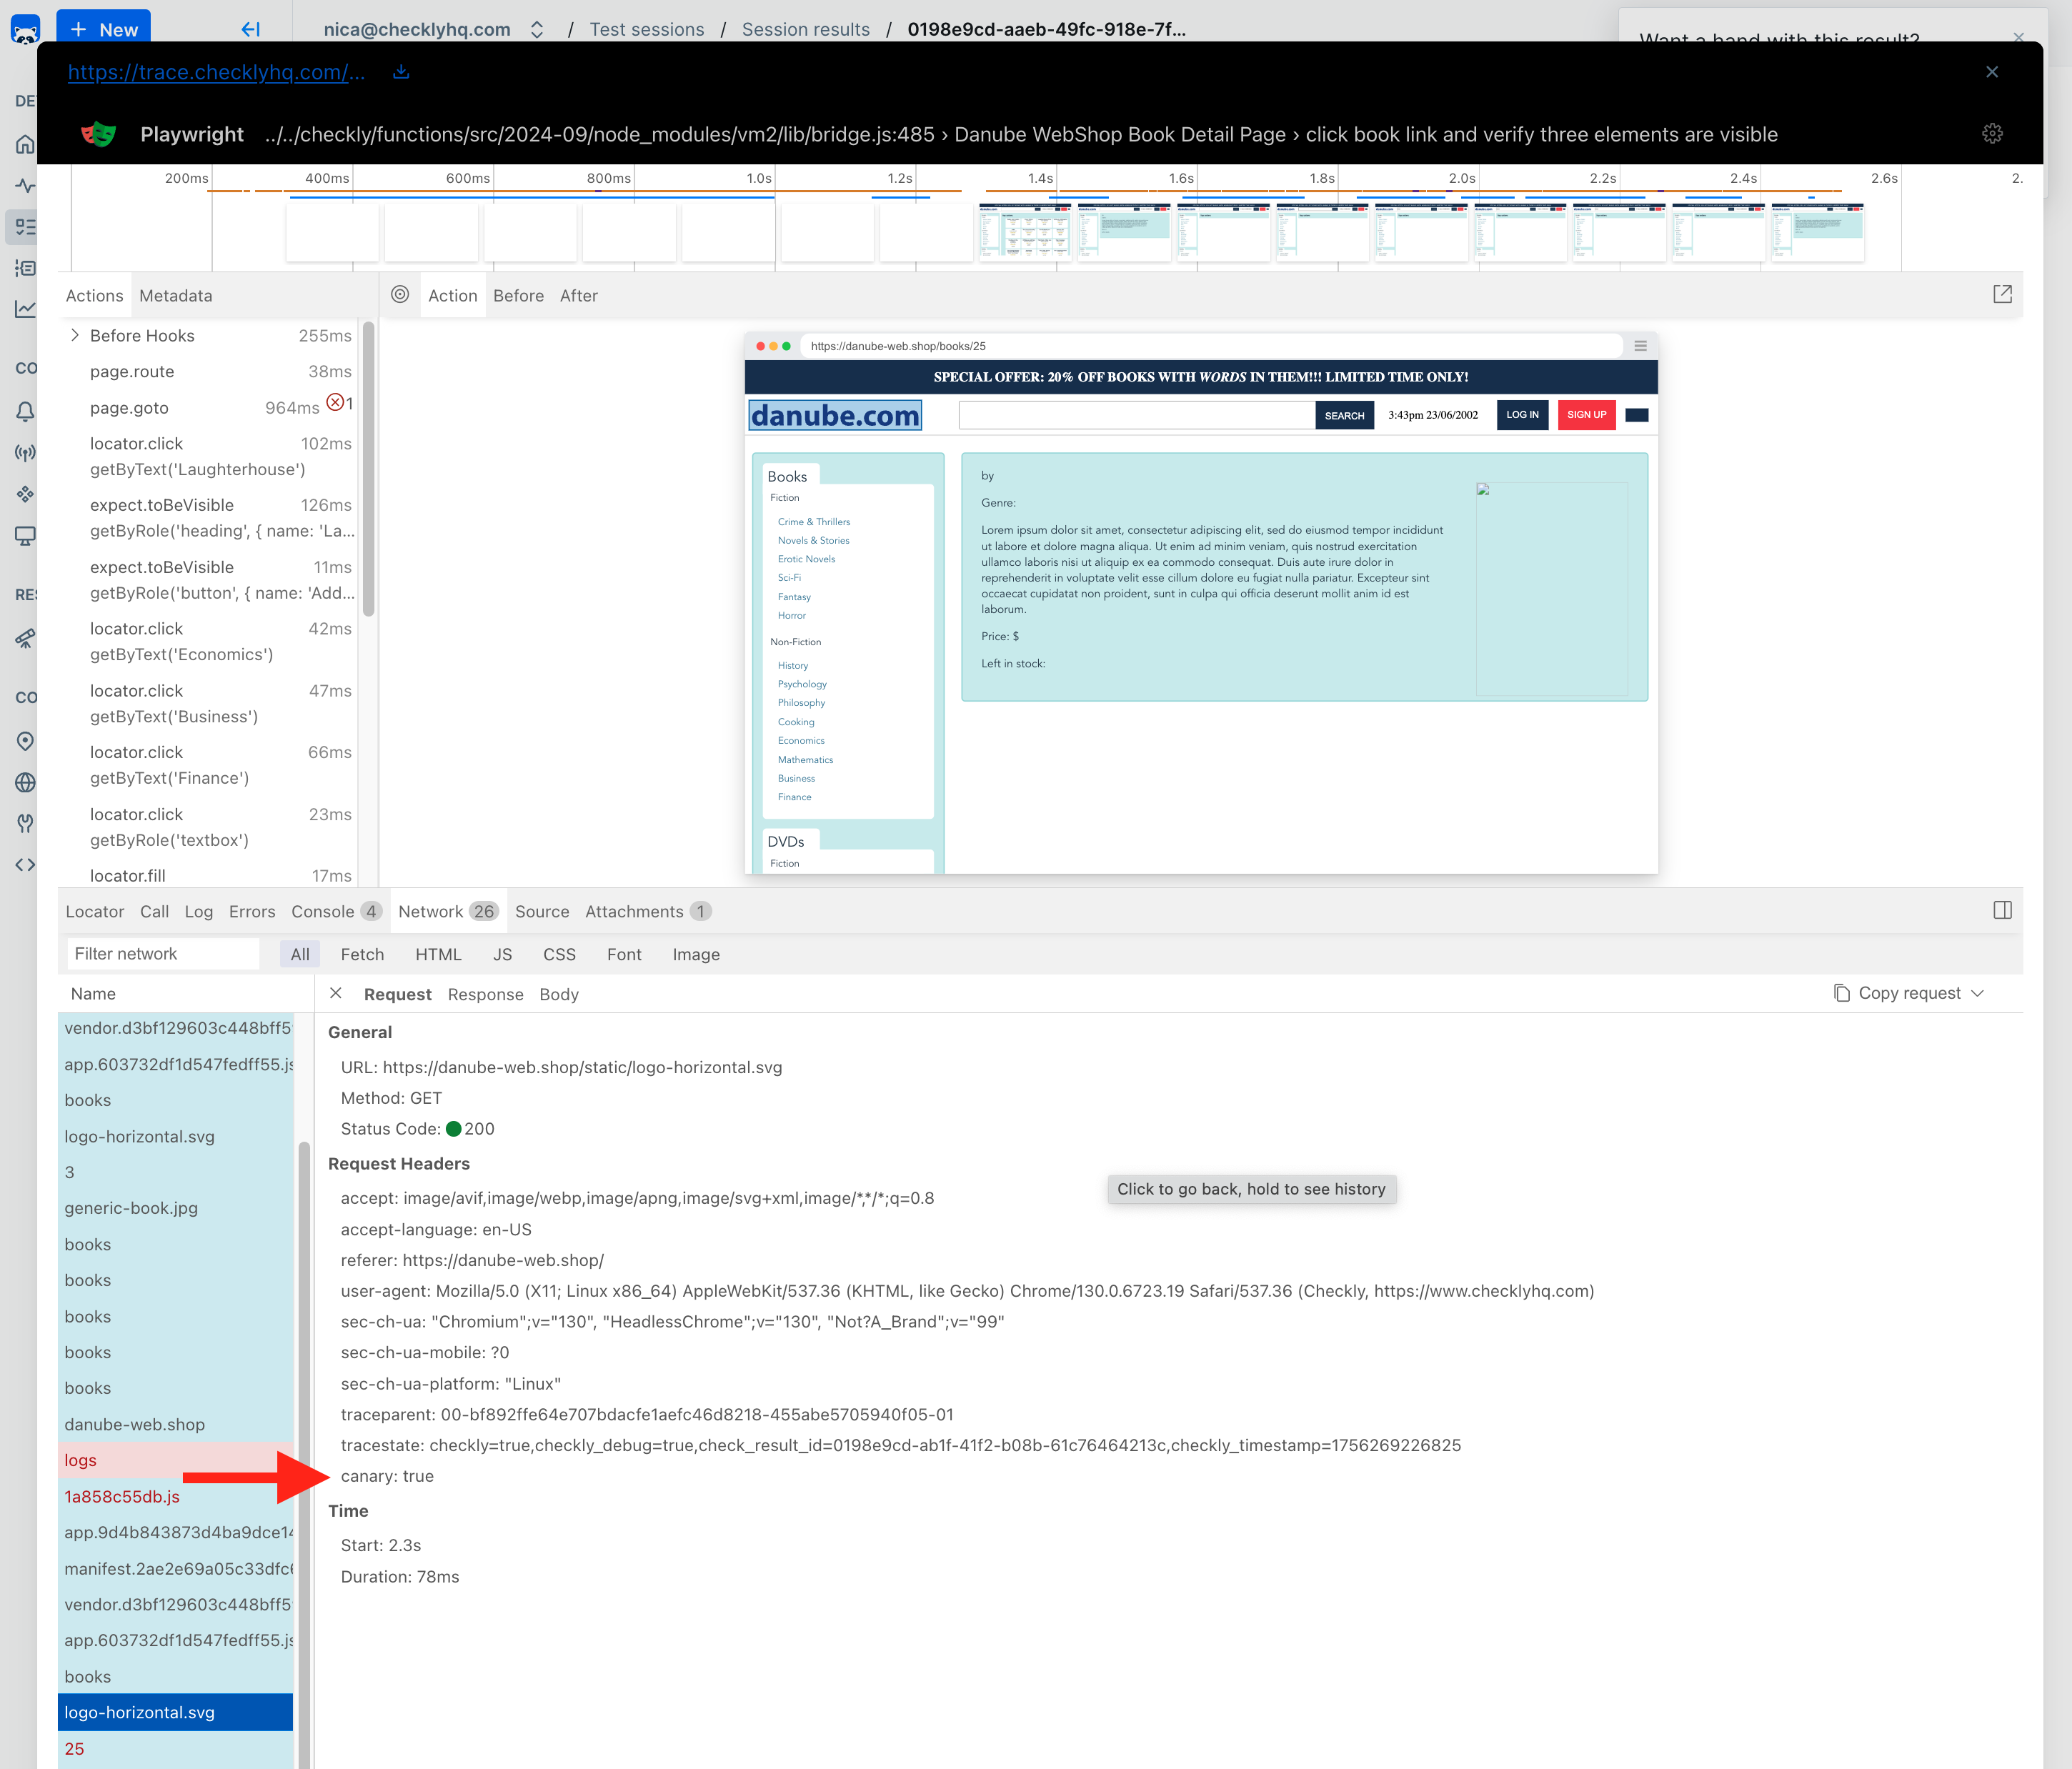
You can click on each to view the report on the check run. Our Browser check will show a full trace, and we can look at our request headers on the network tab:

For both API Checks and Multistep Checks, the headers on request and response are listed in the Checkly web UI

2. Integrate Check Runs With CI/CD - Deploy After a Successful Check Run
Checkly integrates with your CI/CD workflow, and in this example we want to run checks directly after a canary deployment. We’re going to feed environment variables to our monitors so that they know to run with a feature flag.
We aren’t going to wait for a subset of users to try out the canary deployment; rather, we’ll just run our Checkly monitors against the canary deployment and deploy to production if all checks pass.
name: 'Checkly Canary Run'

# Set the necessary credentials and export variables we can use to instrument our check run. Use the ENVIRONMENT_URL
# to run your checks against your canary environment
env:
  CHECKLY_API_KEY: ${{ secrets.CHECKLY_API_KEY }}
  CHECKLY_ACCOUNT_ID: ${{ secrets.CHECKLY_ACCOUNT_ID }}
  ENVIRONMENT_URL: ${{ github.event.deployment_status.environment_url }}
  CHECKLY_TEST_ENVIRONMENT: ${{ github.event.deployment_status.environment }}
  CHECKLY_CANARY_RUN: 'TRUE'
jobs:
  test-canary:
    name: Test E2E for our Canary environment on Checkly
    runs-on: ubuntu-latest
    timeout-minutes: 10
    steps:
      - uses: actions/checkout@v3
        with:
          ref: "${{ github.event.deployment_status.deployment.ref }}"
          fetch-depth: 0
      - uses: actions/setup-node@v3
        with:
          node-version-file: '.nvmrc'
      - name: Restore or cache node_modules
        id: cache-node-modules
        uses: actions/cache@v3
        with:
          path: node_modules
          key: node-modules-${{ hashFiles('package-lock.json') }}
      - name: Install dependencies
        if: steps.cache-node-modules.outputs.cache-hit != 'true'
        run: npm ci
      - name: Run checks # run the checks passing in the ENVIRONMENT_URL and the IS_CANARY flag, and recording a session.
        id: run-checks
        run: npx checkly test -e IS_CANARY=${{ env.CHECKLY_CANARY_RUN }} ENVIRONMENT_URL=${{ env.ENVIRONMENT_URL }} --reporter=github --record
      - name: Create summary # export the markdown report to the job summary.
        id: create-summary
        run: cat checkly-github-report.md > $GITHUB_STEP_SUMMARY
      - name: Deploy Production # if the check run was successful and we are on Test, deploy to Production
        id: deploy-production
        if: steps.run-checks.outcome == 'success' && github.event.deployment_status.environment == 'Test'
        run: production-deploy # Your production deploy command
This check run will start with IS_CANARY set to 'TRUE' and possibly a special ENVIRONMENT_URL for our canary deployment. Let’s modify book-detail-canary.spec.ts from our examples above to work as either a regular production check, or a canary check that sets a special header and checks a different URL when being run as part of a canary deployment.
import { test, expect } from '@playwright/test'

test.describe('Danube WebShop Book Listing', () => {
  test('click book link and verify three elements are visible', async ({ page }) => {
    //set variables based on environment values, with defaults
    const canary = process.env.IS_CANARY! || 'FALSE'
    const baseUrl = process.env.ENVIRONMENT_URL! || 'https://danube-web.shop/'

    await page.route('**/*.svg', async route => { //any route ending in .svg
      const headers = route.request().headers();
      if (canary == 'TRUE'){
        headers['canary'] = 'true'; //add a property only if we're testing against a canary deployment
      }
      await route.continue({ headers });
    });
    await page.goto(`${baseUrl}category?string=scifi`)
    await expect(page.getByText('Laughterhouse-Five')).toBeVisible();
  })
})
Now we can run this same monitor against both our production environments and our canary deployments, with its behavior determined by environment variables.
For our API Checks and other monitors that don’t run Playwright, we can only control their behavior by setting environment variables at the group level, and we can’t follow a ‘multi-pathed’ approach like we do above in our Browser check. The next section will cover using Groups to set environment variables in more detail.
3. Generate Canary Deployment Data With a Separate Check Group
If we can run a set of Checks such that they always ‘see’ the version of our service in a canary deployment, it would be nice to generate data for just that deployment. Checks that are specifically targeted at the canary environment should only run during our canary deployments. To create separate data in our Checkly web UI, and to manage the environment variables of these checks all at once, we can use a Checkly Group.
We’ll start by defining our Group and setting some default values for checks in that group:
import { CheckGroupV2, Frequency, AlertEscalationBuilder } from 'checkly/constructs'
import { smsChannel, emailChannel } from './alert-channels'

export const canaryGroup = new CheckGroupV2('check-group-canary', {
  name: 'Checks run during canary Deploys',
  activated: false, //We'll only activate these checks when needed
  muted: false,
  frequency: Frequency.EVERY_1M,
  locations: ['us-east-1', 'us-west-1', 'eu-central-1'],
  tags: ['canary'], //checks can be run from the CLI by their tag
  // By setting an alertEscalationPolicy, these settings will override those on individual checks
  alertEscalationPolicy: AlertEscalationBuilder.runBasedEscalation(
    1, // Alert after 1 failure, this is way too sensitive for every day but makes sense during a deployment
    { amount: 2, interval: 5 }, // Send 2 reminders, 5 minutes apart
    { enabled: true, percentage: 50 } // Alert if 50% of parallel runs fail
  ),
  alertChannels: [emailChannel, smsChannel],
  environmentVariables: [{ key: 'IS_CANARY', value: 'true' }, { key: 'ENVIRONMENT_URL', value: 'your-canary-env.com' }],
  concurrency: 10
})
Each check we want to add to our group needs just a few lines of code:
import { ApiCheck, AssertionBuilder } from 'checkly/constructs'
import { canaryGroup } from '../utils/canary-group.check'
import * as path from 'path'

new ApiCheck('hello-api-canary', {
  group: canaryGroup,
  name: 'Hello API, Canary Headers',
  request: {
    method: 'POST',
    //sets the url based on an environment variable if available, falls back to default if not
    url: '{{ENVIRONMENT_URL}}' || 'https://httpbin.org/post',
By adding this API check to a group, we can use the environment variables set in the group configuration, and the alert escalation policy, check locations, and whether the checks are activated and/or muted will all be set at the group level.
Once we’ve added the three checks created in this tutorial, our Checkly homepage will have a new group with data for just these canary deployment monitors.

Our process for canary deployments will look something like this:
- Deploy new code to our canary environment(s)
- Set the canary group of checks to active
- Let these monitors run, with very low alert thresholds, until we’re confident in our deployment
- Analyze any failure reports, or if we have none, roll out our code
We can also run our grouped checks ad hoc with the Checkly CLI, since we added a tag to all the checks in this group. With the -t flag we can specify a tag to run:
npx checkly test -t canary --record
Now, even if we have many checks in our project, only the tagged checks will run:
__checks__/api-check-newstyle.check.ts
  ✔ Hello API, Canary Headers (286ms)
__checks__/book-listing-canary.spec.ts
  ✔ book-detail-listing.spec.ts (6s)
__checks__/multistep-api-canary.check.ts
  ✔ Multi-step API Canary Check (586ms)

3 passed, 3 total

Detailed session summary at: https://chkly.link/[yourUniqueLink]
Conclusions
Canary deployments are a powerful strategy for reducing deployment risk, but they require the right monitoring approach to be truly effective. Traditional synthetic monitoring can obscure canary deployment issues in the noise of successful requests from non-canary instances.
This guide demonstrated three complementary approaches to enhance your canary deployments with Checkly:
1. Header-based feature flagging gives you precise control over which version of your service your monitors test. Whether using API Checks, Browser checks, or Multistep Checks, you can ensure your monitors consistently interact with canary instances.
2. CI/CD integration allows you to automate canary validation, running checks immediately after deployment and only proceeding to full rollout if all monitors pass. Environment variables make your checks flexible enough to work in both production and canary contexts.
3. Dedicated check groups provide isolated monitoring data specifically for your canary deployments. With their own dashboards, alerting policies, and environment configurations, these groups give you clear visibility into canary performance without interference from production traffic.
Together, these techniques transform canary deployments from a “hope and pray” exercise into a confident, data-driven process. Your team gains the ability to detect issues faster with targeted monitoring, communicate deployment status clearly with dedicated dashboards, and resolve problems before they affect all users.
The monitoring-as-code approach makes these enhancements scalable and repeatable, ensuring every canary deployment benefits from the same level of observability and control.
Further Reading
Checkly Guides:
- Getting Started with Monitoring as Code - Learn the fundamentals of programmatic monitoring that make canary deployment strategies scalable
- Detect, Communicate, and Resolve with Checkly - A Step-by-Step Tutorial for Engineers - Discover how monitoring as code enhances developer workflows and deployment confidence
- Scaling Your Monitoring Setup Beyond the UI - Explore techniques for managing complex monitoring requirements as your deployment strategies evolve
Checkly Learn:
- Monitoring - Deep dive into monitoring strategies and best practices for deployment validation
- Playwright Testing - Master browser automation techniques used in the canary deployment examples